Python很吃版本,我使用的版本如下:
|
Python 3.7.4 sklearn 0.21.3 |
以下介紹使用scikit-learn來開發隨機森林(random forest),並進行訓練與預測。總共會分成四大步驟,分別如下:
步驟一: 建立資料
步驟二: 訓練模型
步驟三: 驗證模型
步驟四: 進行預測
提供完整程式碼
隨機森林(Random Forest)從維基百科的資料來看,概念是1995年提出,但Random Forest與其演算法是在2001年由Leo Breiman提出,可參考下方兩篇連結:
(Tin Kam Ho, 1995) https://ieeexplore.ieee.org/document/598994/
(Leo Breiman, 2001) https://web.archive.org/web/20210403161446/https://www.stat.berkeley.edu/~breiman/randomforest2001.pdf
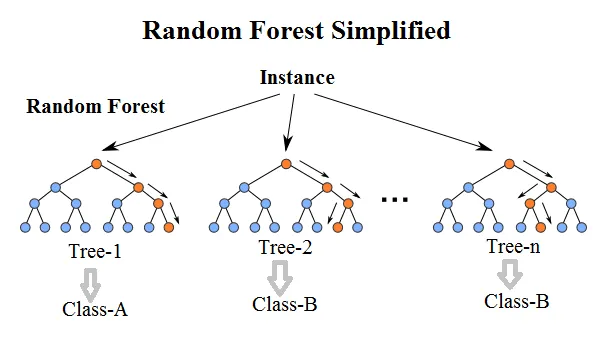
大致上就是由多個決策樹的產出,透過Bagging方法來做判斷,找出正確答案。以下是使用scikit-learn實作的隨機森林:
#step1: 建立資料
#使用scikit-learn內建的手寫數字辨識資料集
from sklearn.datasets import load_digits
digits = load_digits()
#資料內含的欄位
print(digits.keys())
我們把資料的欄位印出來看看,如下:

#印出最後一筆看看長什麼樣子 (ref: https://scikit-learn.org/stable/auto_examples/datasets/plot_digits_last_image.html)
print("最後一筆資料: ",digits.data[-1])
print("最後一筆資料長度: ",digits.data[-1].size)
#圖形化
import matplotlib.pyplot as plt
# Display the last digit
plt.figure(1, figsize=(3, 3)) #設定圖片大小(英吋).
#images[-1]: 最後一張; cmap: colormap, 就是選擇圖片顏色; interpolation是像素呈現的方式, 預設是 nearest
plt.imshow(digits.images[-1], cmap=plt.cm.binary, interpolation="nearest")
plt.show()
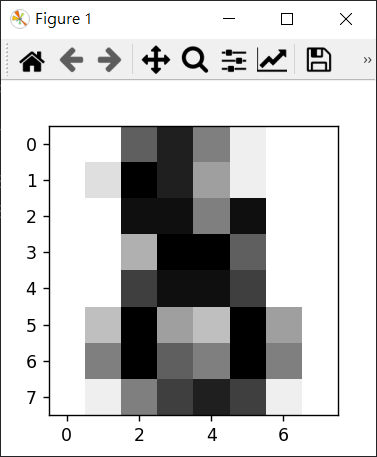
接下來我們把資料印出來看看,分別用向量呈現,還有圖形化方式呈現,然後我show最後一張圖,所以矩陣內的index取-1:

所以向量化方式呈現,可以發現python把圖片轉換成64個維度,代表原本圖片是8x8。
我們使用matplotlib.pyplot函式來呈現圖片
圖片如下:

看完資料格式後,我們使用scikit-learn內建的train_test_split來將資料分成訓練資料與測試資料,test_size參數是代表用來當成測試資料的比例,如果這參數沒有給,預設是0.25。程式碼如下:
#將資料分成訓練與驗證
from sklearn.model_selection import train_test_split
xTrain, xTest, yTrain, yTest = train_test_split(digits.data,digits.target,test_size=0.2,random_state=0)
第二步驟是訓練模型,使用RandomForestClassifier類別n_estimators是決策樹個數,如無此參加,預設是100
#step2: 訓練model
from sklearn.ensemble import RandomForestClassifier
#n_estimators: 是指radnom forest中的決策樹有幾棵, default 是100
randomForestModel = RandomForestClassifier(n_estimators=200);
randomForestModel.fit(xTrain,yTrain);
訓練模型的函式為fit,第一個參數是訓練資料,第二個參數是訓練資料的正確答案。
第三步驟是驗證模型,使用score函式,第一個參數為驗證資料,第二個參數為驗證資料的正確答案。
#step3: 驗證模型
evaluation = randomForestModel.score(xTest,yTest);
print("驗證結果: ", evaluation);
驗證結果:

額外,我們使用scikit-learn裡面呈現驗證結果更好的套件,叫metrics
#使用 metrics套件來分析結果
from sklearn import metrics
predicted = randomForestModel.predict(xTest);
print(metrics.classification_report(predicted,yTest))
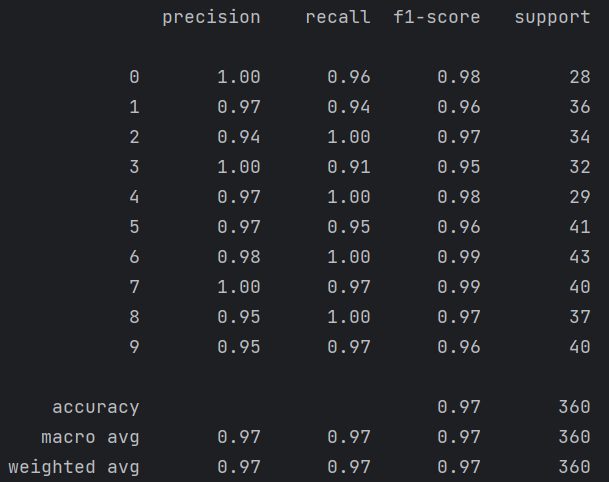
然後先用模型進行驗證資料的預測,將預測結果與驗證資料的正確答案均置入 metrics的classification_report中,可得到下表:

這可以呈現出每個類別的準確度,recall與F-score,可以得知哪個類別比較難預測。
第四步驟,實際用假資料來進行模型預測
#step4: 建立假資料進行預測
import numpy as np
fakeData = np.linspace(1,20,64)
reshapeFakeData = np.array(fakeData).reshape(1,-1)
fakeDataPredicted = randomForestModel.predict(reshapeFakeData)
print("假資料預測結果: ",fakeDataPredicted)
首先,我用numpy的linspace來產生假資料。因為一開始就知道每張圖是用64維表述,所以我這邊假資料也是先做一張圖,產生64個維度,然後使用reshape改成一維。
最後用模型預測結果:

完整程式碼如下:
#step1: 建立資料
#使用scikit-learn內建的數字辨識資料集
from sklearn.datasets import load_digits
digits = load_digits()
#資料內含的欄位
print(digits.keys())
#印出最後一筆看看長什麼樣子 (ref: https://scikit-learn.org/stable/auto_examples/datasets/plot_digits_last_image.html)
print("最後一筆資料: ",digits.data[-1])
print("最後一筆資料長度: ",digits.data[-1].size)
#圖形化
import matplotlib.pyplot as plt
# Display the last digit
plt.figure(1, figsize=(3, 3)) #設定圖片大小(英吋).
#images[-1]: 最後一張; cmap: colormap, 就是選擇圖片顏色; interpolation是像素呈現的方式, 預設是 nearest
plt.imshow(digits.images[-1], cmap=plt.cm.binary, interpolation="nearest")
plt.show()
#將資料分成訓練與驗證
from sklearn.model_selection import train_test_split
xTrain, xTest, yTrain, yTest = train_test_split(digits.data,digits.target,random_state=0)
#step2: 訓練model
from sklearn.ensemble import RandomForestClassifier
#n_estimators: 是指radnom forest中的決策樹有幾棵, default 是100
randomForestModel = RandomForestClassifier(n_estimators=200);
randomForestModel.fit(xTrain,yTrain);
#step3: 驗證資料
evaluation = randomForestModel.score(xTest,yTest);
print("驗證結果: ", evaluation);
#使用 metrics套件來分析結果
from sklearn import metrics
predicted = randomForestModel.predict(xTest);
print(metrics.classification_report(predicted,yTest))
#step4: 建立假資料進行預測
import numpy as np
fakeData = np.linspace(1,20,64)
reshapeFakeData = np.array(fakeData).reshape(1,-1)
fakeDataPredicted = randomForestModel.predict(reshapeFakeData)
print("假資料預測結果: ",fakeDataPredicted)
打完收工,歡迎留言交流。


 留言列表
留言列表